Strategic Business Intelligence (Tableau)

UK Banks Performance Storyline
Tableau-driven narrative analysis of major UK banks focusing on fiscal health and market stability.

Discount Mart Inventory Intel
Real-time Tableau insights into stock turnover, discount impacts, and supply chain bottlenecks.
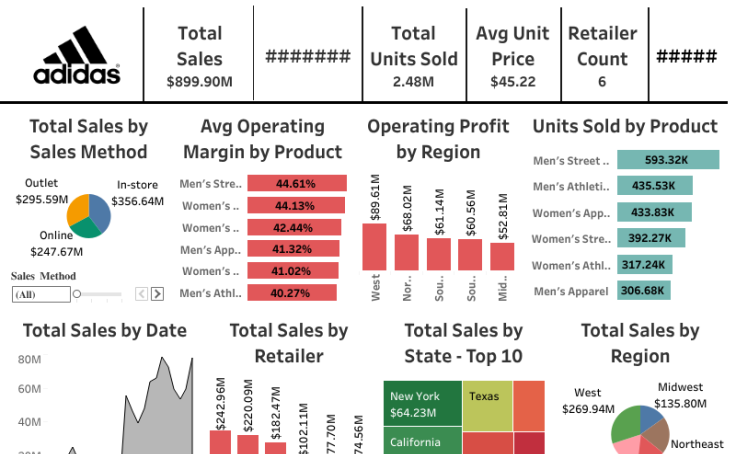
Adidas Sales Analytics Dashboard
Interactive Tableau dashboard analyzing global sales, regional performance, and product trends for Adidas.
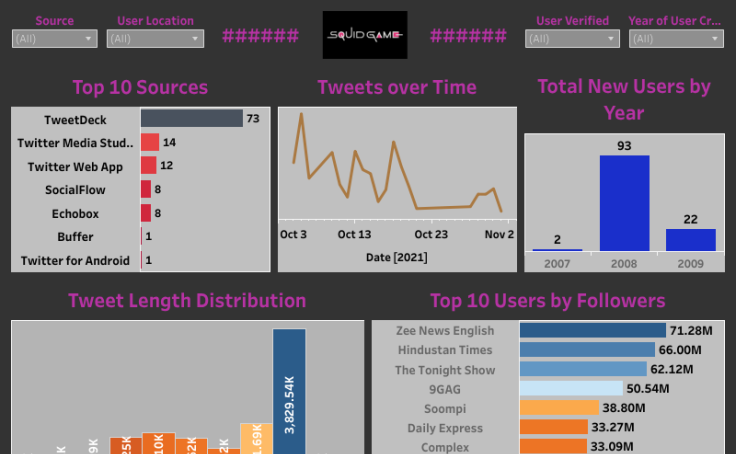
Squid Game Analysis Dashboard
Visualizing viewer metrics, episode ratings, and social reach of the global phenomenon using Tableau.
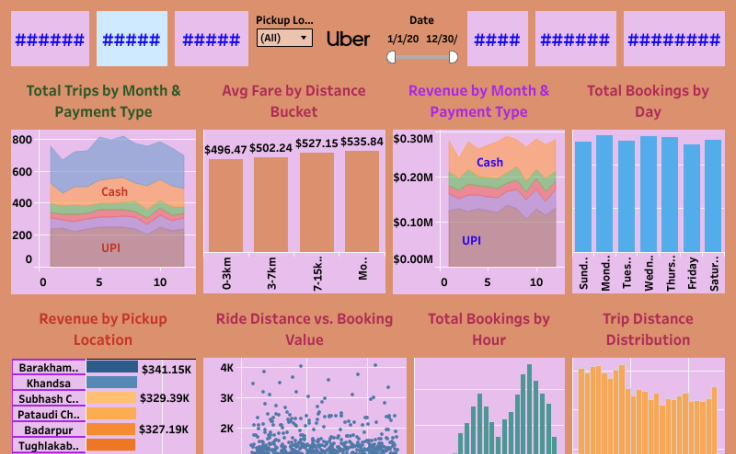
Uber Rides Analysis Dashboard
Comprehensive analysis of ride patterns, peak hours, and geographical demand in urban centers.
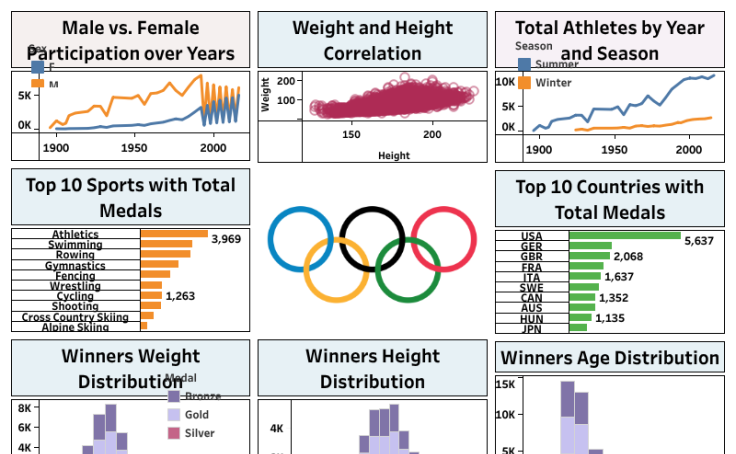
Olympics Analysis Dashboard
Historical data visualization of medal counts, athlete performance, and country-wise trends in the Olympics.
Advanced Enterprise Reporting (Power BI)

Maven Mart Sales Engine
High-fidelity Power BI dashboard analyzing sales performance, product trends, and store efficiency.
Exploratory Data Research (Python/Excel)
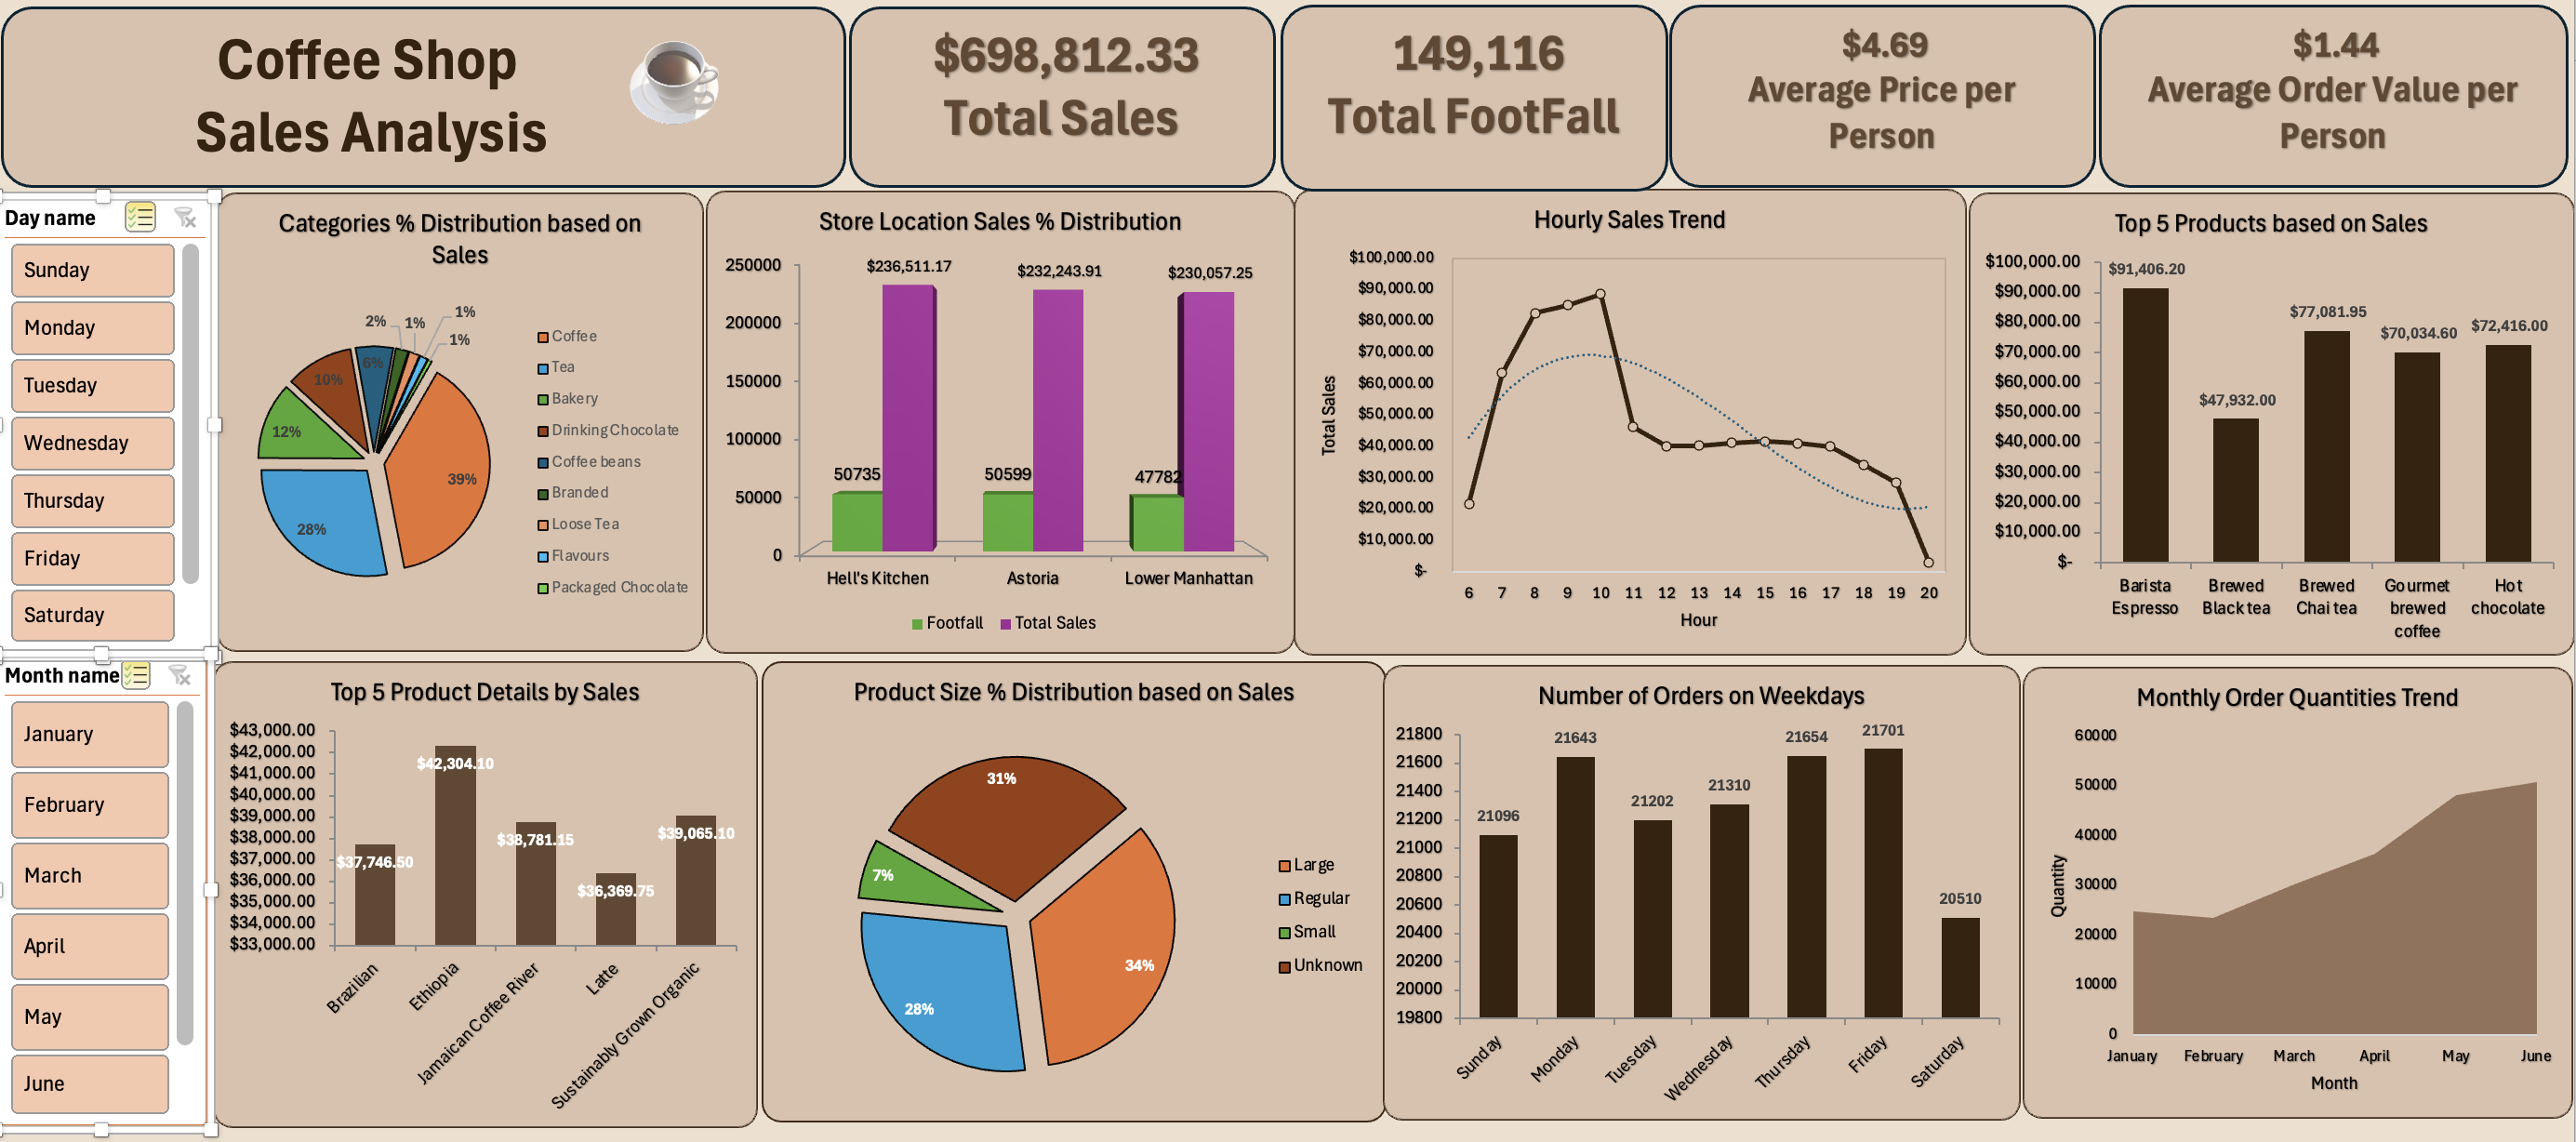
Coffee Shop Sales Analysis
Excel-based pivot analysis and reporting for local retail sales optimization.